It has been a decade of wild weather and climatic conditions - from cyclones to drought, marine heatwaves and the hottest year on record for New Zealand.
What stands out from the decade in review for Niwa meteorologist Maria Augutis is just how many records we've seen in the past 10 years.
"You know, overall, over the past hundred years, the mean temperature for New Zealand has increased around a degree.
"And we do see increasing temperatures and some of the most impressive records over the past 10 years. [One] was the maximum temperature - the one that was recorded in Timaru on sixth of February in 2011.
"That 41.3 degrees, I mean, that's, you know, that's hot anywhere in the world, really."
On the same day Timaru hit that record, there were several locations around the region that broke their own records as well, Augutis says.
Five years of the past decade were in the top 10 hottest years on record for New Zealand.
"Which is - that's wild," Augutis says.
For 29 months from January 2017 to May 2019, Hick's Bay at East Cape had monthly mean temperatures above normal.
Augutis also highlights significant rainfall events - both the highest one day rainfall (869mm on 2 January 2013) and the highest one hour rainfall total (73.6 mm on 4 February 2018) were recorded at Niwa's Cropp River Waterfall rainfall station in the West Coast region.
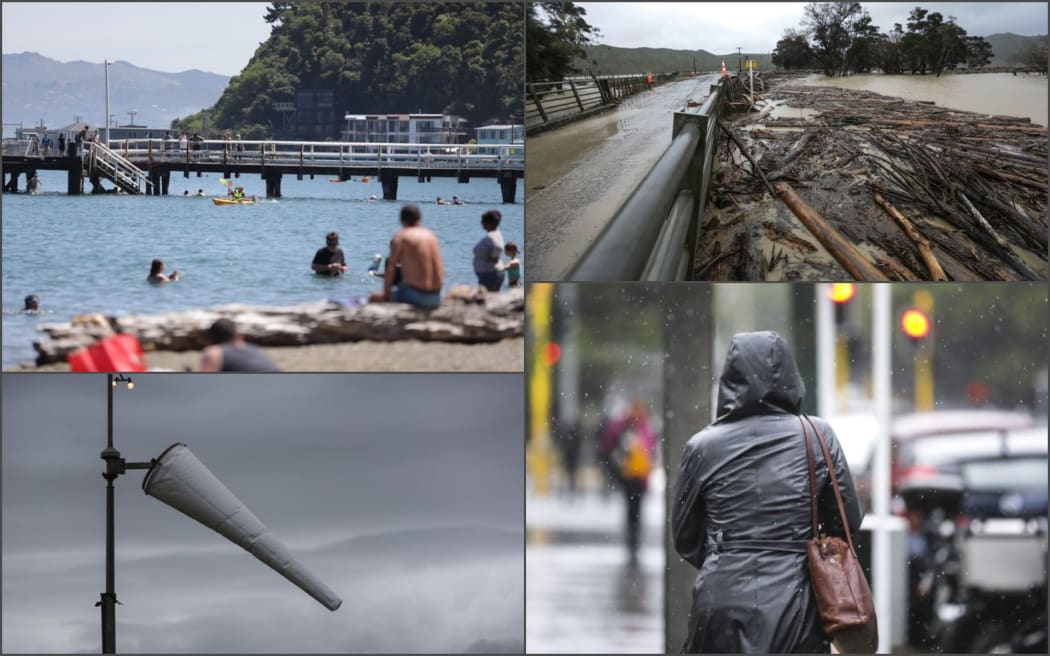
Sunny, scorching days, flooding, extreme winds and pouring rain are all part of the decade's weather. Photo: RNZ
She also points out a wind gust reading from Baring Head outside Wellington, back in 2010.
"They had a record, a maximum of 217km/h. If you start thinking about how fast that actually is, it's crazy. It's very impressive. Wellington is a windy place, but it's not often at all that they reach over 200 kilometres per hour for gusts. So that was one that really stood out to me."
In comparison, the average wind speed - not gust - at Baring Head was 36km/h. At Wellington Airport it was 25.8km/h.
Augutis says the summary of weather is handy for Niwa.
"We deal with statistics all day, every day, and to be able to look back and also see when we get significant weather events coming, what does that mean in the grand scheme of things when you look at it from a historical perspective ... it is very important for us to know the history and know what's been recorded before so to be able to put significant weather events into a greater historical [context]."
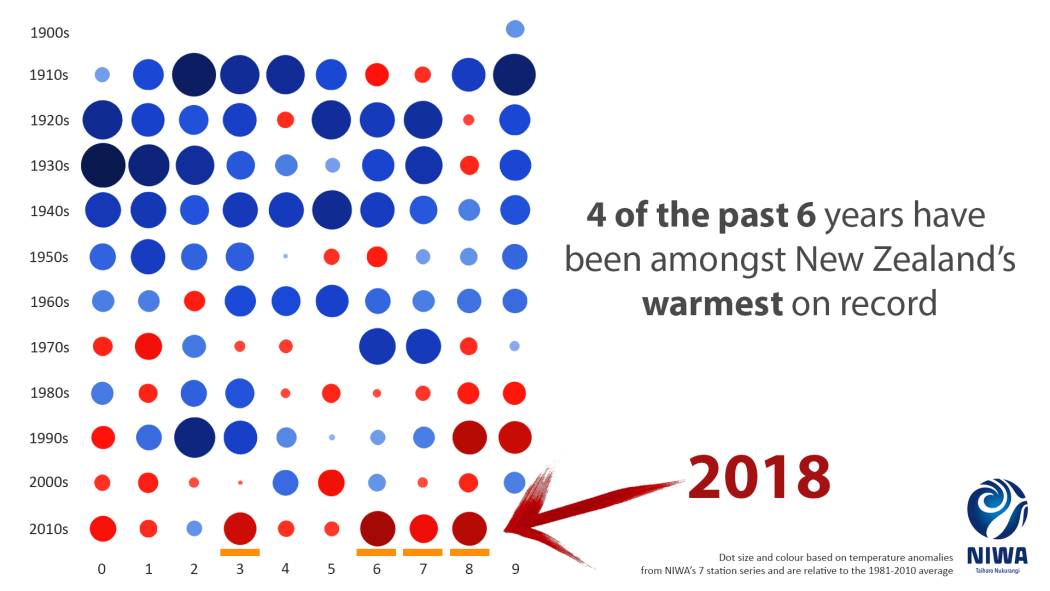
Niwa data shows that four of the past six years have been among the warmest on record in New Zealand. Photo: NIWA / Supplied
Augutis says we'll continue to see more extreme temperatures and weather over the coming decade.
"Earth is warming ... we have to prepare and be ready for more extreme weather events like this to occur and more records to be broken.
"And that's something, you know, when I when I look at all the records I'm shocked with how many how many records we do break and that, that trend will most likely continue as we move into the next decade and the decade after that.
"We're still waiting for the final numbers. We have to run through the month of December as well, but 2019 as a whole will most likely rank in the top five warmest years on record as well.
"So we'll continue that trend - it most likely won't be warmer than 2016, which was the warmest one on record - but we'll continue that trend above average."
More highlights from this decade's weather:
- Highest average maximum daily temperature: Whangarei 20.36°C (record length 3620 days)
- Highest average mean daily temperature: Whangarei, 16.25°C (record length 3617 days)
- Highest average minimum daily temperature: Cape Reinga, 13.28°C (record length 3466 days)
- Lowest average maximum daily temperature: Takahe Valley (Southland), 9.61 °C (record length 3419 days)
- Lowest average mean daily temperature: Takahe Valley (Southland), 5.06 °C (record length 3449 days)
- Lowest average min daily temperature: Takahe Valley (Southland), 1.05 °C (record length 3419 days)
- Warmest SST: West of Northland, 25.1˚C on 13 February 2019
- Largest positive sea surface temperature anomaly: Coastal Canterbury, +6.9˚C above average on 9 December 2017
- Coolest sea surface temperature: East of Otago, 4.9˚C, 18 August 2018
- Largest negative sea surface temperature anomaly: West of Chatham Island, -4.5˚C below average, 12 December 2015
Source: CliDB data from 2010-01-01 - 2019-12-03.
What's coming for the rest of summer?
Niwa's seasonal climate outlook for summer said temperatures were expected to be above average for the country - with the exception of the west of the South Island, where there's of more a chance for temperatures to be near average.
Rainfall is likely to be about normal for most of the country - except again for the west of the South Island, where it was equally likely there will be more rain than normal.
Sea surface temperatures are above average in some areas, and that's expected to continue through summer.
"Potential impacts include increased chances for above average warmth and/or the modification of cooler air masses as they move toward NZ," Niwa said.
Air pressure over summer is expected to be lower than normal to the west and south of New Zealand with higher than normal air pressure north of the country.
"This is expected to be associated with a westerly quarter air flow anomaly, especially during December. In the second half of the season, due to an expected shift in large scale climate drivers, persistent westerly quarter winds may ease and tend northeasterly quarter.
"A potential transition from westerly winds in December to northeasterly quarter winds later in the summer could have an impact seasonal rainfall (e.g. areas that are wetter (drier) in early summer may be drier (wetter) for the second half of the season)."