New Zealanders are mostly staying at home during lockdown, with trips to the supermarket down by 54 percent and transport hubs by 84 percent, according to a new data report from Google.
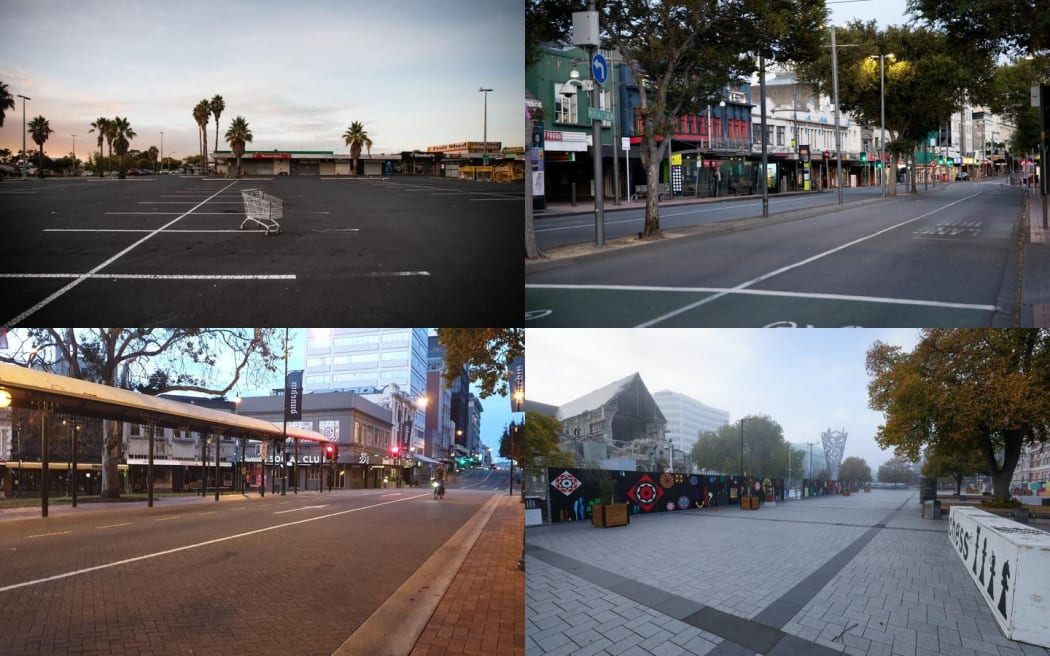
Empty streets across New Zealand (clockwise, from top left) in Auckland, Wellington, Christchurch and Dunedin. Photo: RNZ
Google has been tracking New Zealanders' movements to show how often we are going to work, parks, supermarkets and transport hubs during lockdown.
The tech giant recently released community mobility reports for 131 countries, saying it had heard from public health officials that the data would be useful in their response to Covid-19.
The report for New Zealand is based on Sunday 29 March, the fourth day of lockdown. It compares data from that Sunday with the average Sunday between January 3 and February 6 of this year.
It showed New Zealanders' trips to retail and recreation facilities, such as restaurants, cafes, shopping centres and libraries were down 91 percent.
Trips to groceries and pharmacies were down 54 percent, trips to parks, beaches and public gardens were down by 78 percent and visits to transport hubs, such as bus and train stations, had dropped by 84 percent.
Visits to workplaces were down by 59 percent and the trend for 'places of residence' was up by 22 percent. The data is broken down for regions at the bottom of this article.
The reports were generated from people who have their location history setting turned on, "so may or may not represent the exact behaviour of a wider population".
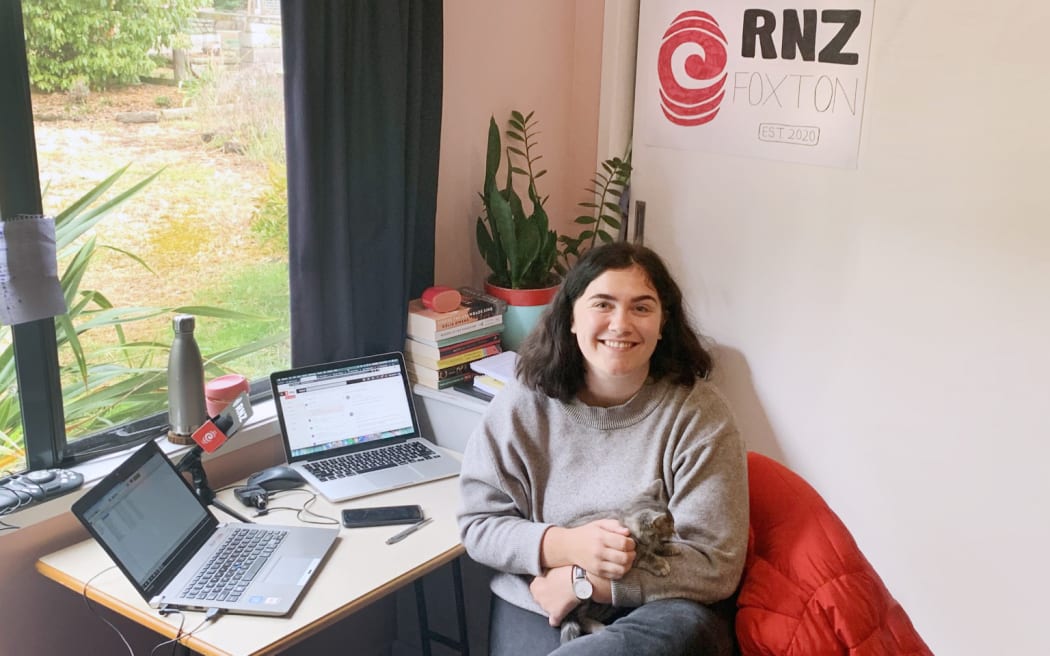
Many of RNZ's reporters are working from home during lockdown Photo: Supplied
Google said it used "differential privacy" which added artificial noise to the datasets, which enabled "high quality results without identifying any individual person". It would not disclose how many people the reports were based on.
In a blog post, Google chief health officer Karen DeSalvo and Google Geo senior vice president Jen Fitzpatrick explained how Google used aggregated, anonymised data showing how busy certain types of places were.
"In addition to other resources public health officials might have, we hope these reports will help support decisions about how to manage the Covid-19 pandemic. For example, this information could help officials understand changes in essential trips that can shape recommendations on business hours or inform delivery service offerings.
"Similarly, persistent visits to transportation hubs might indicate the need to add additional buses or trains in order to allow people who need to travel room to spread out for social distancing.
"Ultimately, understanding not only whether people are travelling, but also trends in destinations, can help officials design guidance to protect public health and essential needs of communities."
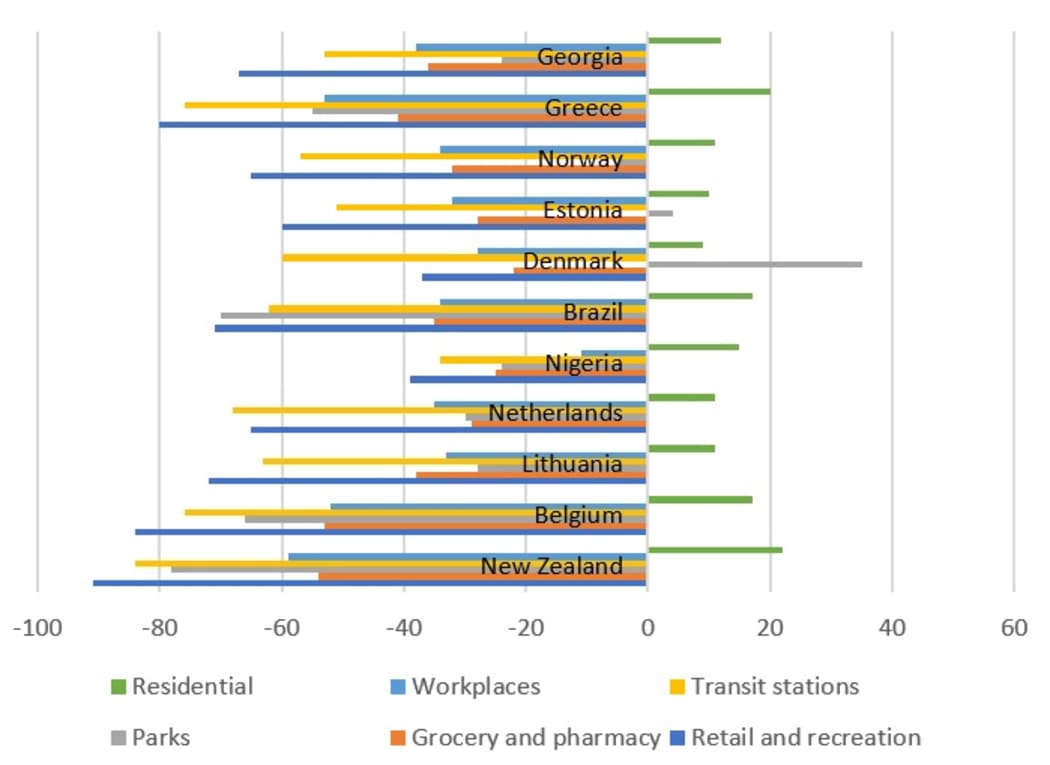
How New Zealand's data compares to other countries Photo: RNZ
RNZ compared the data for New Zealand to reports for 10 other countries which reported their first confirmed cases of Covid-19 on the same day as New Zealand or the day before.
All of the countries have enforced some sort of quarantine or lockdown.
Of the 10 countries, New Zealand reported the highest level of reduced travel to all categories listed in the Google data reports.
RNZ has approached Ministry of Health for comment.
How New Zealand's regions compare
Auckland
- Retail and recreation -89 percent
- Supermarkets and pharmacies -55 percent
- Parks -70 percent
- Transit stations -83 percent
- Workplace -64 percent
- Residential +25 percent
Bay of Plenty
- Retail and recreation -92 percent
- Supermarkets and pharmacies -51 percent
- Parks -86 percent
- Transit stations -83 percent
- Workplace -52 percent
- Residential +22 percent
Canterbury
- Retail and recreation -90 percent
- Supermarkets and pharmacies -56 percent
- Parks -83 percent
- Transit stations -90 percent
- Workplace -60 percent
- Residential +22 percent
Gisborne
- Retail and recreation -100 percent
- Supermarkets and pharmacies -48 percent
- Parks -88 percent
- Transit stations - Not enough data
- Workplace -47 percent
- Residential - Not enough data
Hawke's Bay
- Retail and recreation -94 percent
- Supermarkets and pharmacies -53 percent
- Parks -78 percent
- Transit stations -84 percent
- Workplace -51 percent
- Residential +31 percent
Manawatu-Whanganui
- Retail and recreation -93 percent
- Supermarkets and pharmacies -50 percent
- Parks -76 percent
- Transit stations -84 percent
- Workplace -54 percent
- Residential +33 percent
Marlborough
- Retail and recreation -92 percent
- Supermarkets and pharmacies -60 percent
- Parks -83 percent
- Transit stations -91 percent
- Workplace -25 percent
- Residential - Not enough data
Nelson
- Retail and recreation -100 percent
- Supermarkets and pharmacies -60 percent
- Parks -81 percent
- Transit stations - Not enough data
- Workplace -61 percent
- Residential +4 percent
Northland
- Retail and recreation -93 percent
- Supermarkets and pharmacies -55 percent
- Parks -86 percent
- Transit stations -86 percent
- Workplace -52 percent
- Residential +32 percent
Otago
- Retail and recreation -95 percent
- Supermarkets and pharmacies -62 percent
- Parks -82 percent
- Transit stations -91 percent
- Workplace -64 percent
- Residential +39 percent
Southland
- Retail and recreation -96 percent
- Supermarkets and pharmacies -53 percent
- Parks -83 percent
- Transit stations - Not enough data
- Workplace -48 percent
- Residential +21 percent
Taranaki
- Retail and recreation -95 percent
- Supermarkets and pharmacies -52 percent
- Parks -86 percent
- Transit stations -Not enough data
- Workplace -51 percent
- Residential +17 percent
Tasman
- Retail and recreation -90 percent
- Supermarkets and pharmacies -67 percent
- Parks -89 percent
- Transit stations - Not enough data
- Workplace -54 percent
- Residential - Not enough data
Waikato
- Retail and recreation -94 percent
- Supermarkets and pharmacies -55 percent
- Parks -84 percent
- Transit stations -82 percent
- Workplace -57 percent
- Residential +23 percent
Wellington
- Retail and recreation -93 percent
- Supermarkets and pharmacies -54 percent
- Parks -63 percent
- Transit stations -84 percent
- Workplace -62 percent
- Residential +20 percent
West Coast
- Retail and recreation -100 percent
- Supermarkets and pharmacies -61 percent
- Parks -87 percent
- Transit stations - Not enough data
- Workplace -54 percent
- Residential - Not enough data
Read more about the Covid-19 coronavirus:
- See all RNZ Covid-19 news
- A timeline: How the coronavirus started, spread and stalled life in New Zealand
- Covid-19 symptoms: What they are and how they make you feel
- Touching your Face: Why do we do it and how to stop
- Scientific hand-washing advice to avoid infection
- Coronavirus: A glossary of terms
- The Coronavirus Podcast