Carbon Watch NZ is a collaborative project to measure our greenhouse gases – where they are coming from and where they are going to.
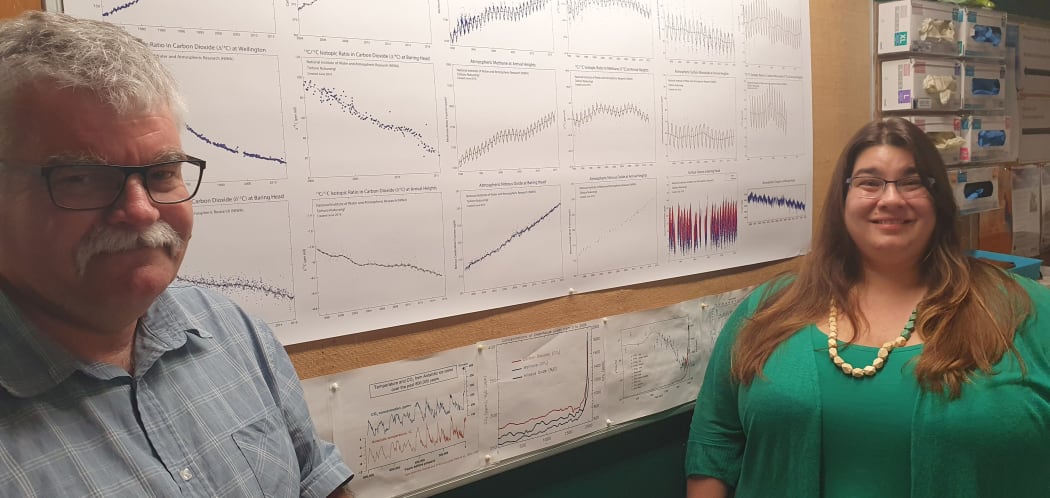
NIWA atmospheric scientists Gordon Brailsford and Sara Mikaloff Fletcher stand next to plots showing levels of various gases in the atmosphere measured over time. Photo: RNZ / Alison Ballance
Find Our Changing World on Apple Podcasts, Spotify, Stitcher, iHeartRADIO, Google Podcasts, RadioPublic or wherever you listen to your podcasts
When it comes to greenhouse gases in the atmosphere, the biggest culprit is carbon dioxide (CO2) – and it’s something that New Zealand has been interested in for a long time.
New Zealand is home to the longest running continuous carbon dioxide measurements in the southern hemisphere, second only to Hawaii in the northern hemisphere.
Measurements began here fifty years ago, initially at Makara, near Wellington. They were set up by atmospheric scientist Dave Lowe, who worked for many years at NIWA.
Since 1972, measurements have been made at the Baring Head clean air station on the north side of Cook Strait near Wellington.
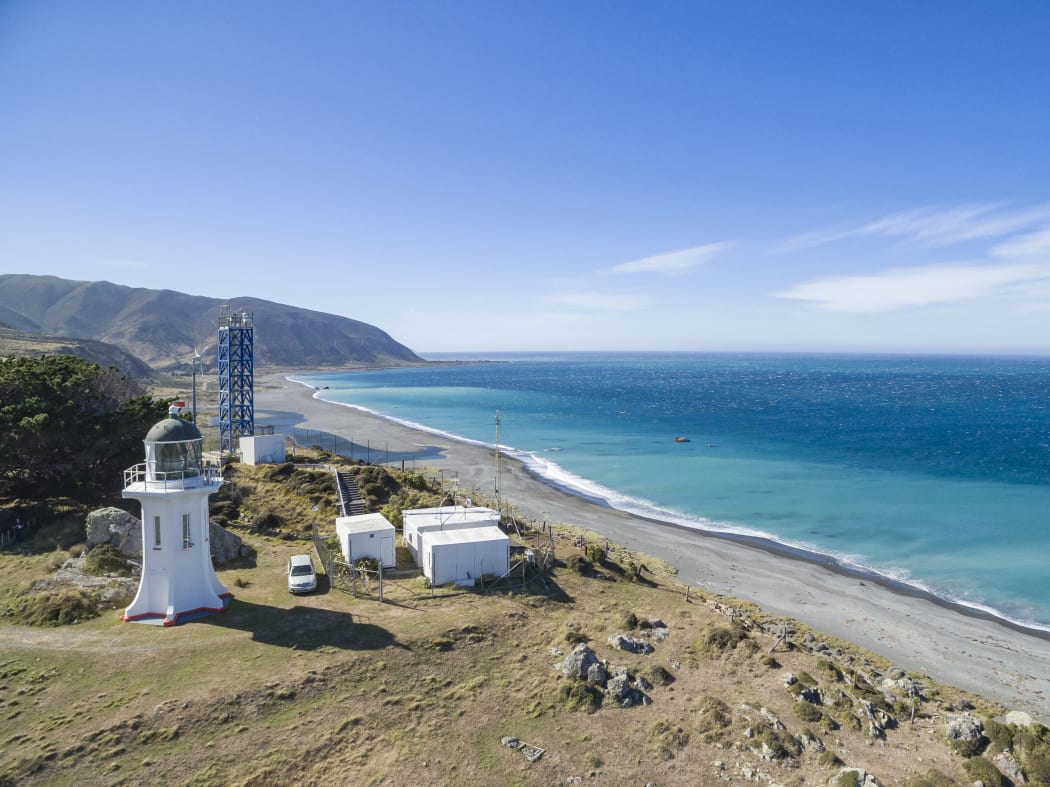
NIWA's clean-air monitoring station at Baring Head. Photo: Dave Allen / NIWA
Atmospheric carbon dioxide levels before the Industrial Revolution were 280 parts per million (PPM).
Dave vividly remembers the first measurements he recorded at Baring Head.
“It was in December 1972, and yes, it was very exciting,” says Dave. “We used chart recorders back then and you saw this straight line, which meant that you were measuring an incredibly stable CO2 concentration – and it was around 323 parts per million.”
Carbon dioxide concentrations in the atmosphere have since risen to around 410 PPM.
“In my working lifetime it’s gone up around 90 parts per million,” says Dave. “And that’s the whole of the earth’s atmosphere. It’s a huge hit on the chemical and physical properties of the earth’s atmosphere – the only atmosphere that we have.”
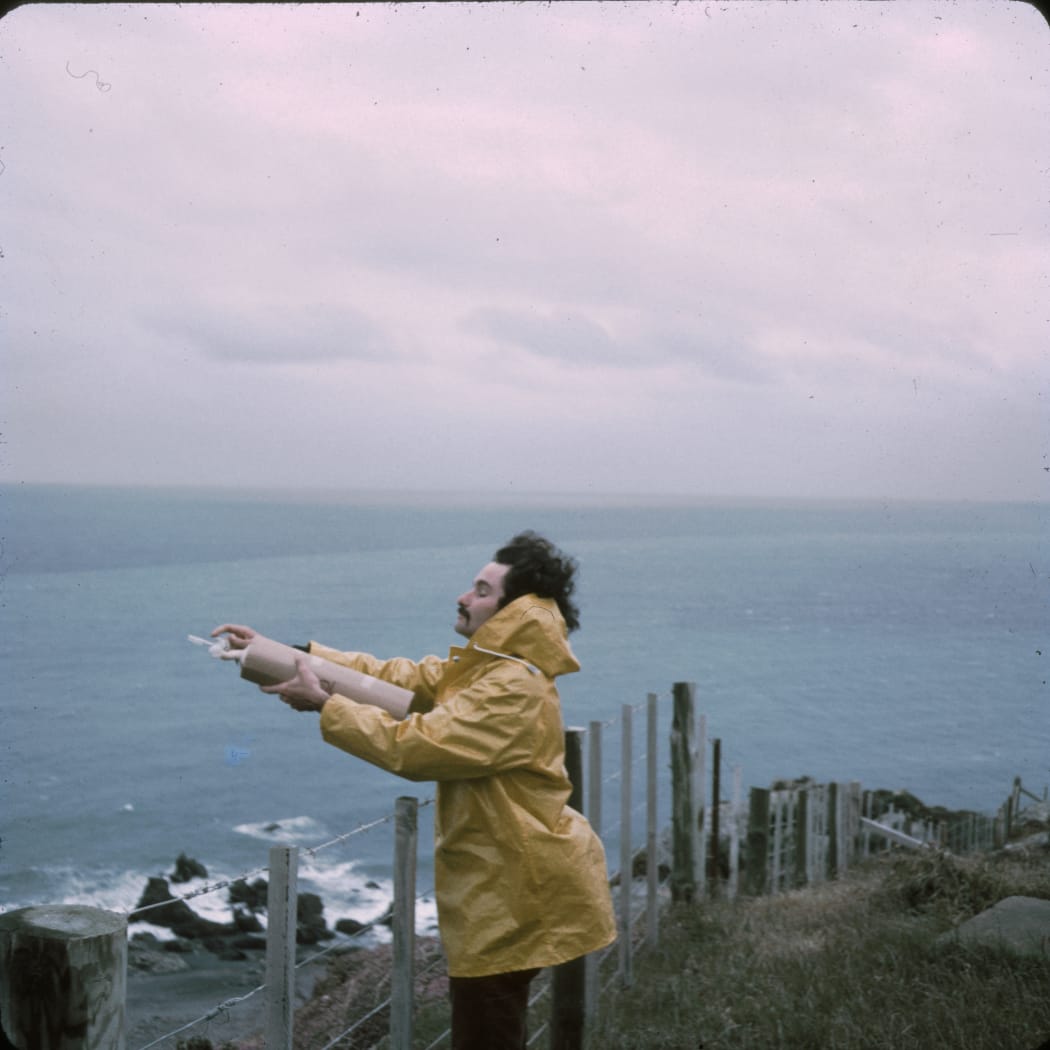
Dave Lowe taking an air flask sample at the edge of the Baring Head cliff in 1972. Photo: Dave Lowe
Keeling’s contribution
NIWA technician Gordon Brailsford is an expert in measuring atmospheric gases, and he says that when he began work in this area, CO2 levels were at 347 PPM.
Although sophisticated technology is now used for measuring many types of atmospheric gases, Gordon says that they also still use a method that Dave began using back in the early 1970s.
Keeling bottles were developed by American scientist Charles ‘Dave’ Keeling, who began the first long term CO2 measurements in Hawaii in 1958.
They are a vacuum flask, which are filled with air by opening the valve “into the teeth of a southerly wind” and sucking in air that, at Baring Head, has blown across the southern ocean from Antarctica.
This clean oceanic air provides background measurements of CO2 concentration that are not influenced by processes on land.
The graph of steadily rising global CO2 concentrations since 1958 is known as the Keeling curve.
“What’s interesting is that it’s not a linear process of increase – it’s accelerating,” says Gordon.
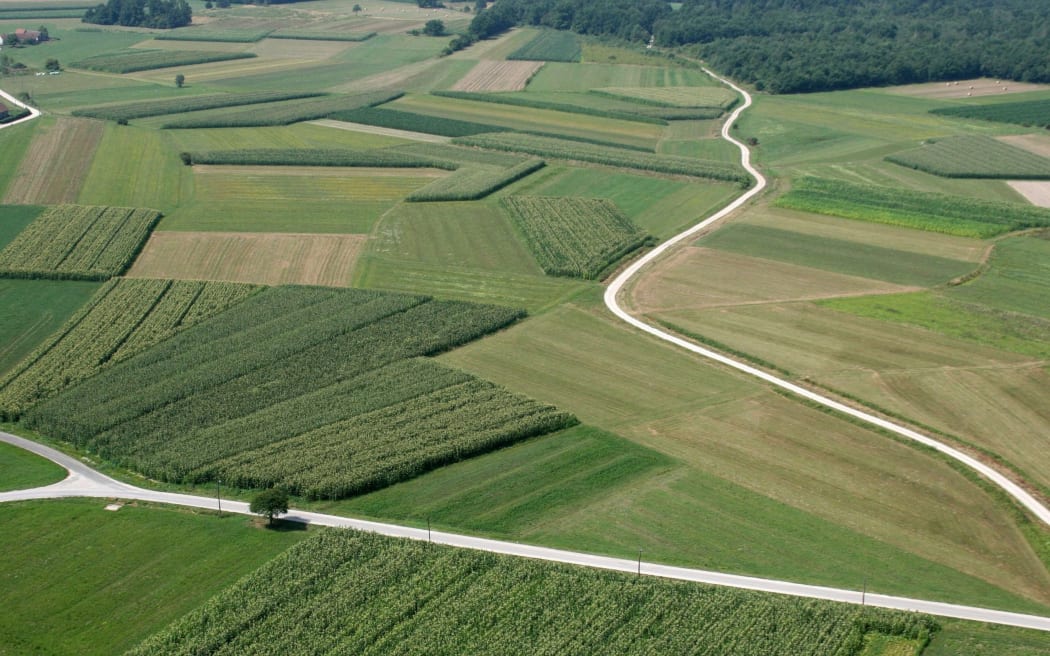
Photo: 123RF
Carbon Watch NZ
The Carbon Watch NZ project began in 2019, with funding from MBIE’s Endeavour Fund. It is a collaboration between NIWA, GNS Science and other research organisations.
It aims to build the world’s first complete national-scale picture of a country’s carbon balance by measuring greenhouse gases in the atmosphere.
NIWA atmosphere and ocean scientist Sara Mikaloff Fletcher describes it as giving us a bird’s eye view of our carbon balance.
Sara’s modelling is developing a top-down picture of our country’s carbon balance – knowing where the CO2 comes from - the sources - and where it goes to - the sinks - across forests, agricultural and urban areas.
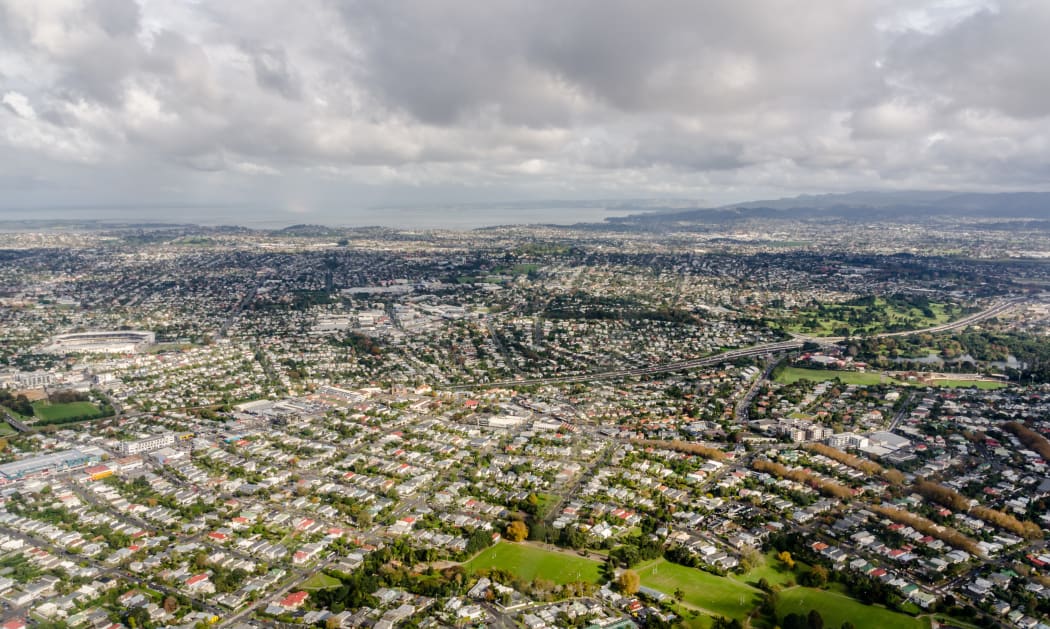
Photo: 123rf
Sara takes data on atmospheric gas concentrations, collected from a network of sampling stations across the country, and combines it with NIWA’s high-resolution weather forecasting model to tease out where the air that was sampled had come from.
She says that as air moves across the land it either picks up or loses carbon, depending whether the land is a sink or a source.
“The wind is always changing,” says Sara. “So, if you’ve got a little bit of elevation one station can tell you stories about all different parts of the region.”
“You have a site and a place, but it tells you about every place the wind ever comes from.”
Sara says that globally we have a good idea of how much CO2 we are putting into the atmosphere from fossil fuel emissions. She is interested in working out where all that CO2 goes.
“About half of the CO2 we put in the atmosphere stays in the atmosphere,” says Sara. “But half of the carbon is absorbed by sinks.”
Of that, she says about half ends up in the oceans and the other half ends up in the terrestrial biosphere.
Sara uses a sophisticated Lagrangian model which “hops backward in time along the wind path and tells us a picture of all the places the air arrived from.”
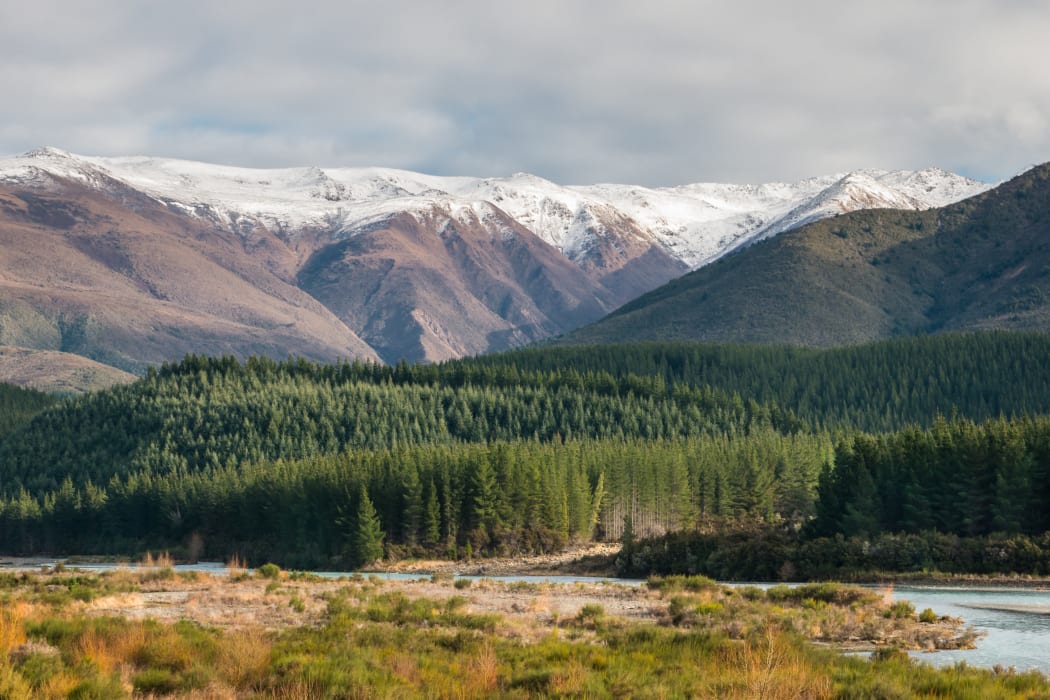
Pine forest, next to the Wairau River in the South Island. Photo: 123RF
Surprising forests
Carbon Watch NZ has already revealed some surprising results.
“The biggest surprise in our pilot study was how much carbon was being absorbed in the South Island.”
Old growth native forests in Fiordland are absorbing and storing large amounts of carbon, which Sara says was not expected.
“The traditional thinking is that forests take up a lot of carbon when they first grow …but as they become mature, forests they come close to an equilibrium-type state where they’re not absorbing or emitting very much carbon.”
The other traditional idea has been that exotic trees grow faster than native trees and this should mean that exotic forests in New Zealand would absorb more carbon.
Sara says she doesn’t understand what is happening in Fiordland and whether it’s a feature of the trees themselves or the location.
“If there’s something special about our indigenous trees, then that opens up new doorways for new ways that we could offset our carbon emissions,” says Sara.